Find the most complex code using eslint
1st February, 2018
5 min read
Everyone knows of components in their codebase that are unwieldy and hard to maintain. As your codebase ages and your team grows it gets difficult to figure out which piece of code should demand your attention first.
Eslint can help!
**Note: ** There is a github repo to accompany this article at https://github.com/mlennox/eslint-complexity-checking
**Update: ** I have created a proper eslint formatter and released it as an npm package - eslint-formatter-complexity
Find the most complex code using eslint
With smaller teams and less pressure to deliver it is much simpler to keep technical debt in check. If you are working on a large project as a member of one of many teams it is likely you will be very familiar with some of the codebase, but much of it will be a murky realm of hidden dangers and sea monsters, ready to drag you to the depths and steal your time away!
It often takes an extended collaborative effort just to pinpoint which parts of the codebase need to be refactored. Any group discussion about the quality of code and ways of working is beneficial, but often the amount of effort required means the required joint discussion gets put aside due to deadlines.
This process can be automated to some degree by using eslint. It is not a panacea as it can only report on the complexity metrics on a file-by-file basis. It does little to indicate the validity of an architecture or design pattern, and will not replace a proper team discussion.
It is a huge time-saver in pinpointing files that have become difficult to maintain, and should help overcome the reluctance of most developers to jump into a refactor. Helpfully, the eslint reports tell you what problems occur on which lines in specific files.
Which metrics?
The following code issues make your code more difficult to grok:
- cyclomatic complexity
- too many statements per function
- too many statements per line
- excessive params in functions
- number of nested callbacks
- nesting in code blocks
- file length
Code that has any of these issues can be harder to maintain and understand, so it is worthwhile taking a little time to refactor, reduce and remove unwanted complexity. You need to recognise it first!
Formatters
Eslint provides a number of default 'formatters' which format the output of eslint, on the command line, in various ways - json, html, table, compact etc.
The repo that accompanies this post has implemented a custom formatter that sorts the results, bubbling the worst offending, most complex files to the top of the list so they are obvious; like a gargoyle on a cathedral.
Checking your codebase
Using the accompanying repo, you should be able to get started using the following simple commands - assuming you have fulfilled the prerequisites.
npm install
npm run lint:sorted
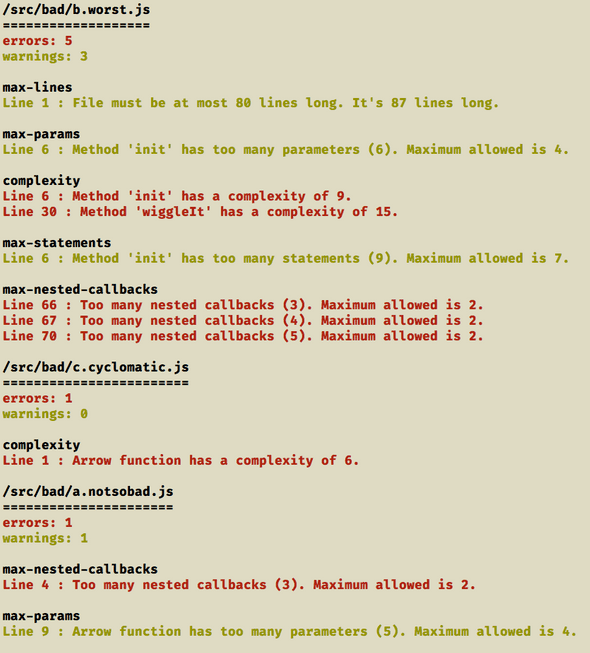
This will generate the following report.
Note the files are sorted by descending complexity - actually sorted by error count and then warning count. The report groups the rule violations together, colour-coding them as warnings in yellow and errors in red.
Just pick the file at the top of the list and refactor - easy!
Standard report
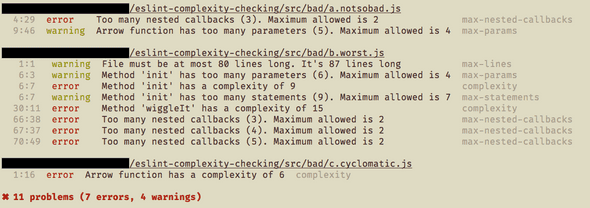
Compare this to the standard eslint output, which sorts alphabetically, and presents the rule violations in the order they occur in the file.
Such a report run against a large codebase makes it difficult to pinpoint where to start, and any extra hurdles to overcome makes it all the less likely the code will get refactored!
Cyclomatic weighting
The cyclomatic complexity of a file is a measure of the independent paths through a piece of code.
In the custom formatter, this measure is divided by four and added to the error or warning count (this is set in the eslint config) before being evaluated when sorting the list of problematic files.
This is why, in the example, the file c.cyclomatic.js with only a single cyclomatic error is listed above the file a.notsobad.js which has 1 warning and 1 error. None of the problems in a.notsobad.js are due to cyclomatic complexity so they are relatively less important when you consider the entire codebase.
For the example above, the file b.worst.js has two instances of excessive cyclomatic complexity.
complexity
Line 6 : Method 'init' has a complexity of 9.
Line 30 : Method 'wiggleIt' has a complexity of 15.
They both will contribute extra weighting to the file - 9 / 4 = 3 and 15 / 4 = 4 for a total of 7 added to the warning count - ensuring it will appear at the top of the list of problem files.
Why aren't all the files listed
The code in the good/good.example.js exhibits no complexity issues and therefore will not appear in the list of problem files.


