Benchmarking implementations of 'cosine' distance between matrix rows
5th November, 2018
3 min read
As part of creating an encoder/decoder model, we want to find the cosine distance between each row in one array and each row in a second using scipy.spatial.distance.cdist. One implementation will loop through the first array row by row, find the cosine distance and keep track of the lowest value. The second will take a vectorised approach to find the cosine similarity between the two matrices and then find the smallest cosine distance for each row.
Show me the code
There is a python script that accompanies this post at my github : cdist-timings
What is cosine distance?
There are a number of ways to compare vectors, the main being calculating the 'geometric' distance between the points, called the Euclidian distance. Another, which is sufficient for word embeddings is to find the cosine similarity, basically the angle between the vectors.

The use-case here is finding similarities between the word embeddings in two matrices - for word embeddings the amplitude of the vector does not matter as they should have been normalised, the angle between vectors is important.
Motivation
A tutorial I was following used a loop implementation of the cdist search, I vectorised it in my own code, but I wanted to know what the benefit was in real terms. The exercise of semi-formally benchmarking the implementations was also useful.
Notes on the implementation
We are comparing how long it takes two implementations to find the most similar vectors between two matrices.
To generate the data, we loop through a range of axis sizes for the two matrices, then we run a timing test against the implementations a number of times, generating unique matrices each time - matching the current axis dimensions. We also repeat the timing test for each set of data a number of times to even out any variations.
Each row of data contains the x and y axis dimensions of the two matrices/arrays and the full set of repeated results for each data set.
| x    | y   | loop duration | vectorised duration |
| ---- | --- | ------------- | ------------------- |
| 1000 | 300 | 0.0595        | 0.0233              |
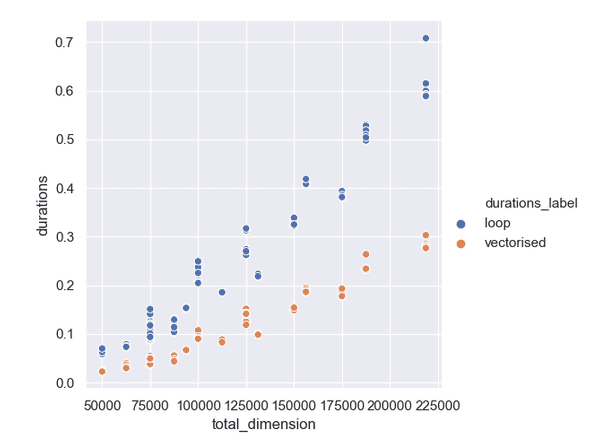
To plot the data we calculate the total dimension by multiplying the x and y dimension, using that as the x-axis to the plot. The values of the duration are plotted on the y-axis.
Results
The plot shows a solid factor of 2 difference between the time the duration of the loop implementation and the vectorised version.

